ESG data
Environmental
| Environmental data | Unit | FY 2021/3 | FY 2022/3 | FY 2023/3 |
|---|---|---|---|---|
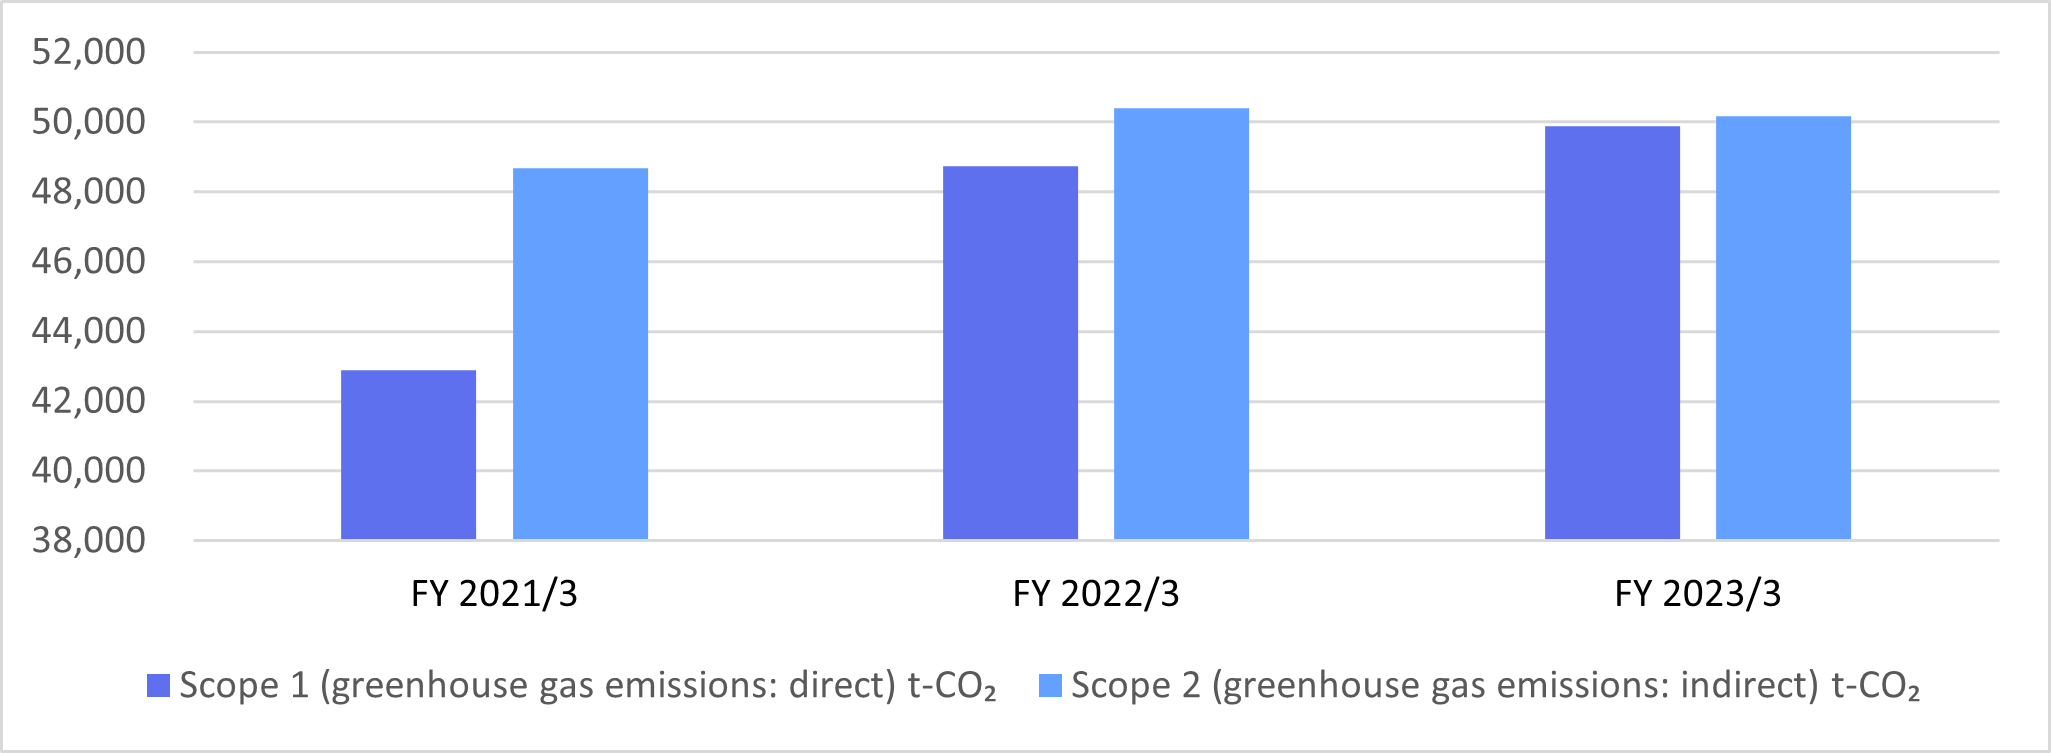
| Scope1 (greenhouse gas emissions: direct) |
t-CO₂ | 42,879 | 48,734 | 49,875 |
| Scope2 (greenhouse gas emissions: indirect) |
t-CO₂ | 48,681 | 50,387 | 50,167 |
| Electricity usage | 1,000 kWh | 109,395 | 116,367 | 115,454 |
| Water usage | 1,000 ㎥ | 1,296 | 1,455 | 1,618 |
| Gasoline | kL | 5,375 | 5,838 | 5,913 |
| Power generation from renewable energy | 1,000 kWh | 4,072 | 3,824 | 4,193 |
| Amount of waste | t | 3,506 | 3,866 | 2,748 |
| Reuse and recycling rate of Pachinko and Pachislot machines* | % | 99.1 | 99.1 | 99.0 |
| Raw materials* | t | 3,252 | 3,641 | 4,625 |
※Range: Heiwa Group (FY ended March 31, 2021: 15 companies, FY ended March 31, 2022: 16 companies, FY ended March 31, 2023: 11 companies), * indicates Heiwa Corporation only
※Scope 2: Location-based emissions
※Power generation from renewable energy: Power generated by facilities on the company’s premises (solar power generation, wind power generation)
Social/HR
| Social/HR data | Unit | FY 2021/3 | FY 2022/3 | FY 2023/3 |
|---|---|---|---|---|
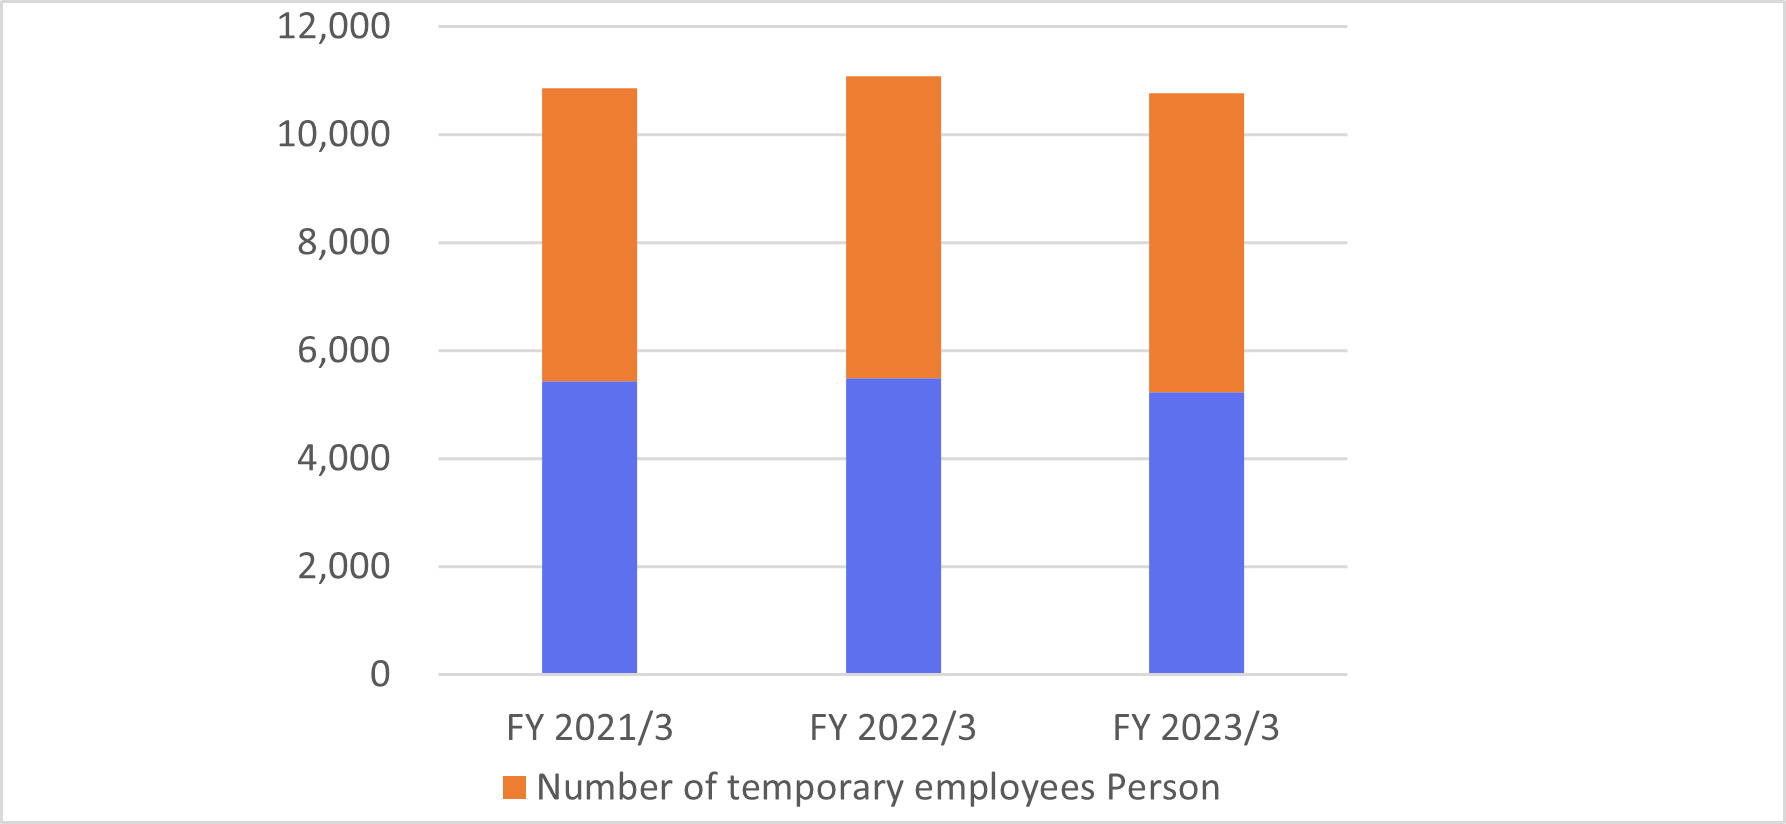
| Number of permanent employees | Person | 5,436 | 5,484 | 5,237 |
| Number of temporary employees | Person | 5,421 | 5,591 | 5,526 |
| Average length of service (men)*¹ | Years | 17 | 18 | 18 |
| Average length of service (women)*¹ | Years | 16 | 17 | 17 |
| Number of new graduate recruits (men) | Person | 30 | 53 | 59 |
| Number of new graduate recruits (women) | Person | 60 | 100 | 74 |
| Number of mid-career recruits (men) | Person | 775 | 1,019 | 926 |
| Number of mid-career recruits (women) | Person | 602 | 779 | 643 |
| Turnover rate*¹ | % | 2.3 | 32.0 | 3.2 |
| Gender pay gap (all workers)*¹ | % | – | – | 77.9 |
| Gender pay gap (permanent employees)*¹ | % | – | – | 76.9 |
| Gender pay gap (part-time and fixed-term workers)*¹ | % | – | – | 48.8 |
| Paternity leave utilization rate (men)*¹ | % | – | – | 27 |
| Paternity leave utilization rate (men)*² | % | – | – | 24 |
| Number of people taking nursing care leave | Person | 7 | 2 | 2 |
| Paid leave utilization rate*¹ | % | 61.8 | 77.4 | 73.3 |
| Amount of investment in education (per person) | yen | 5,573 | 5,475 | 3,438 |
※Range: Heiwa Group (FY ended March 31, 2021: 15 companies, FY ended March 31, 2022: 16 companies, FY ended March 31, 2023: 11 companies), *¹ indicates Heiwa Corporation only, *² indicates Pacific Golf Management K. K. only
※Turnover rate: Voluntary retirement scheme implemented in FY ended March 31, 2022
Governance
| Governance data | Unit | FY 2021/3 | FY 2022/3 | FY 2023/3 |
|---|---|---|---|---|
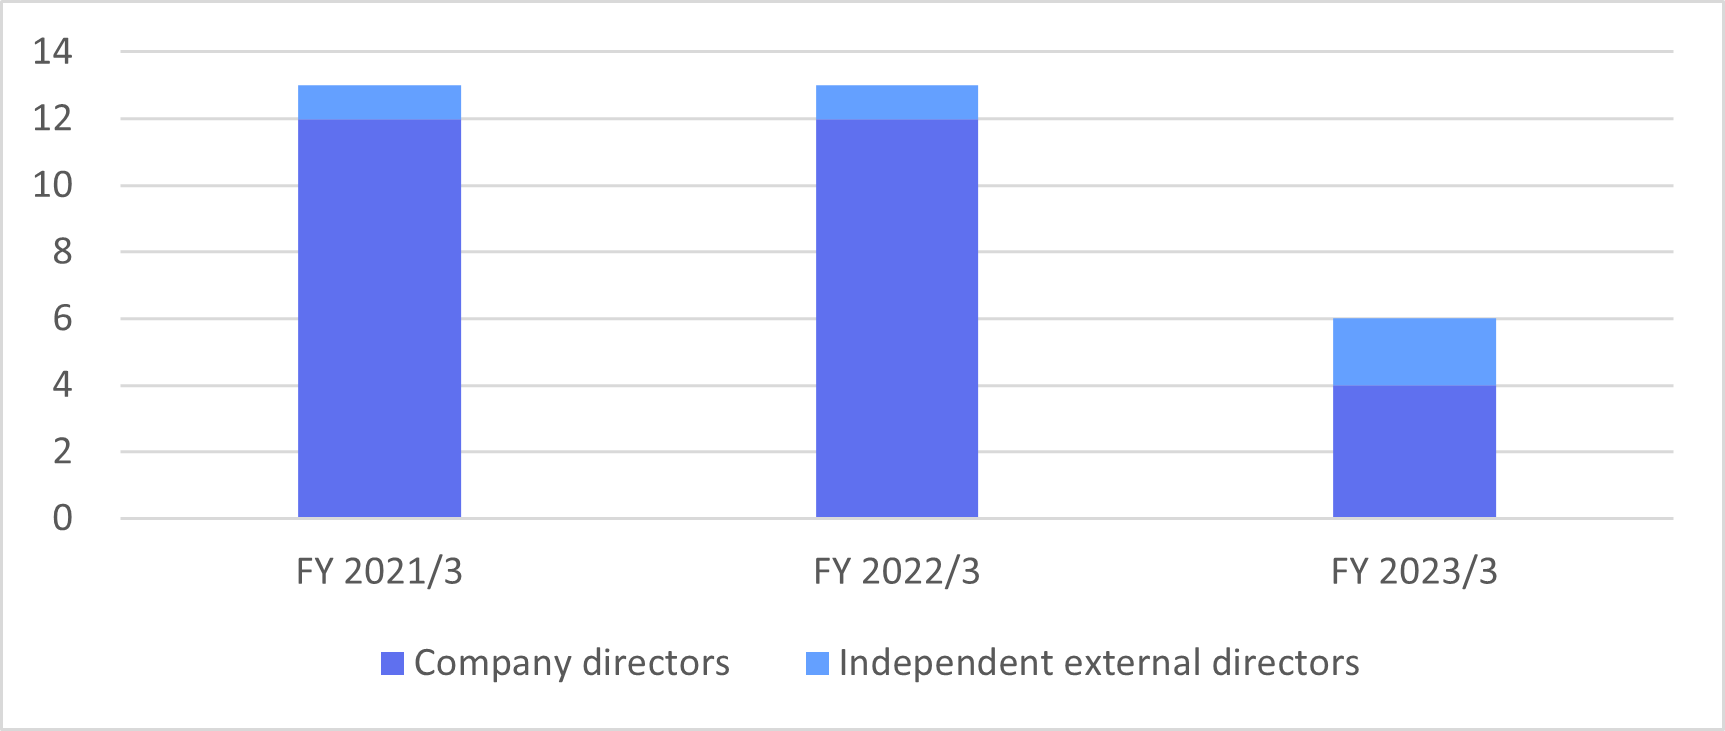
| Company directors | Person | 12 | 12 | 4 |
| Independent external directors | Person | 1 | 1 | 2 |
| Number of board meetings | times | 18 | 17 | 16 |
| Attendance rate at board meetings | % | 98.6 | 99.0 | 96.8 |
| Directors’ remuneration | Million yen | 319 | 303 | 174 |
| Internal auditors | Person | 1 | 1 | 1 |
| Independent external auditors | Person | 2 | 2 | 3 |
| Number of internal reports* | Number of reports | 58 | 49 | 61 |
※Range: Heiwa Corporation only, * indicates the Heiwa Group (FY ended March 31, 2021: 15 companies, FY ended March 31, 2022: 16 companies, FY ended March 31, 2023: 11 companies)